


 Why on earth would a bank charge negative interest rates? It's so " upside down" and counter-intutive we thought it would be a good idea to cover the topic in this weeks blog post.
During times of economic uncertainty central banks lacking in policy alternatives to stimulate the economy have turned to unconventional policies such as negative interest rates to stimulate the economy. The use of negative interest rates is a tool to counter potential deflationary spirals where - in times of economic uncertainty - there is less incentive on the part of businesses and consumers to spend and therefore less investment, growth, profits and a higher propensity for unemployment which in turn creates a negative feedback loop. By offering negative interest rates banks disincentivize individuals and businesses to hold cash at banks as it now costs depositors money to do so (which turns the traditional banking model on its head) and encourages businesses and individuals to borrow money by actually being paid to borrow by the banks.
Sweden was the first to experiment with negative rates in July 2009 when the Reiksbank cut interest rates to -.25%. The ECB (European Central Bank) did so in 2014 lowering its interest rate to -0.10%. Other European countries and Japan have done likewise with over $10 trillion in government debt carrying instrument with negative yields by 2017. The objective is to encourage banks to lend money rather than hold reserves at the central banks (where they are now charged for the privilege). Another objective is to use negative interest rates to devalue a currency and in essence make it more competitive, stimulating the economy through demands for export of goods and thereby encouraging business expansion. This has been one of the objectives of the ECB.
...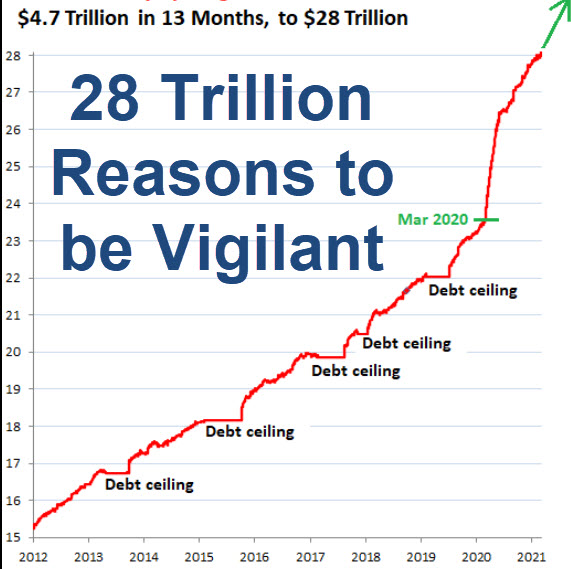 $28 Trillion - take a moment to reflect on this number - is the current total of the US National Debt. As of June 17th it is precisely
 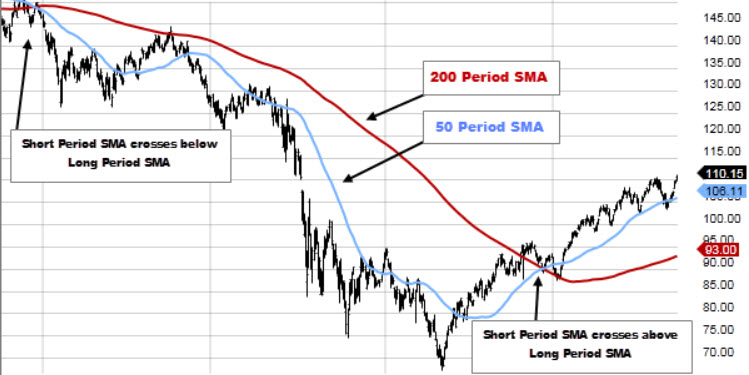 Stock, Commodity or Bond prices do not move in a straight line. All fluctuate with changing variables including but not limited to economic, political, competitive, human or technological factors. Identifying price trends is the underlying basis of technical analysis and critical to traders and investors whether it is over a short, medium or long term basis. To do this, the technical analyst has hundreds of technical indicators at their disposal that are now also woven together in trading algorithms, AI (artifical intelligence) and trading BOT's that operate independent (largely) of any human.
 We have seen this movie before. After the roaring 1920's, the stock market melted up to euphoric highs only to crash in stupendous fashion. In the internet boom of the late 1990's the NASDAQ hit likewise euphoric highs only to crash back down to earth. Following extremely lax lending practices coupled with low interest rates the flying real estate boom coupled with mortgage backed securities fueled the 2007/8 great recession taking the entire banking and monetary system to the brink. Massive stimulus injections lifted us out of that great depression.
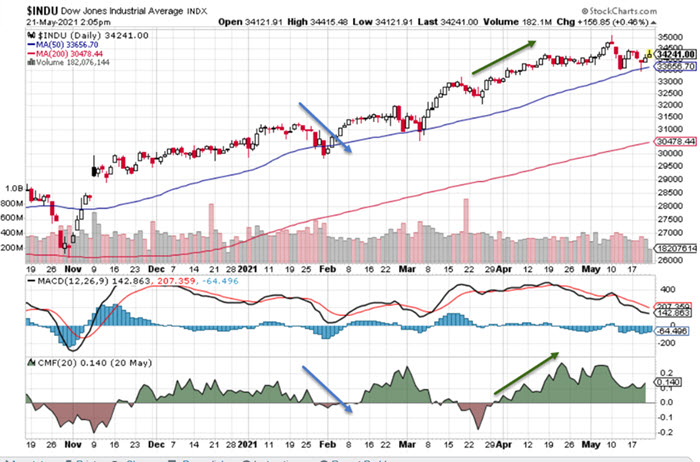 There is a whole lot of Chaikin going on! In todays blog post we are continuing the series about technical analysis and the large toolbox of indicators available. Today we are looking at an indicator that attempts to measure money flows into and out of a security.