


 We have seen this movie before. After the roaring 1920's, the stock market melted up to euphoric highs only to crash in stupendous fashion. In the internet boom of the late 1990's the NASDAQ hit likewise euphoric highs only to crash back down to earth. Following extremely lax lending practices coupled with low interest rates the flying real estate boom coupled with mortgage backed securities fueled the 2007/8 great recession taking the entire banking and monetary system to the brink. Massive stimulus injections lifted us out of that great depression.
Economists have long seen repeating economic cycles in history. Booms followed by Bubbles and then Busts with long periods of economic stagnation, only for the cycle to repeat. We have written about this before but want to write about it again because while we have seen this movie before in the US and all around the world, the movie we are seeing unfold the US today is different to one's we have seen in US history.
The convergence of record national debt, stimulus, low interest rates, inflation, a booming stock market in the midst of a global recession have created a mix of ingredients that could fuel one of the great bubbles and busts of the modern era.
...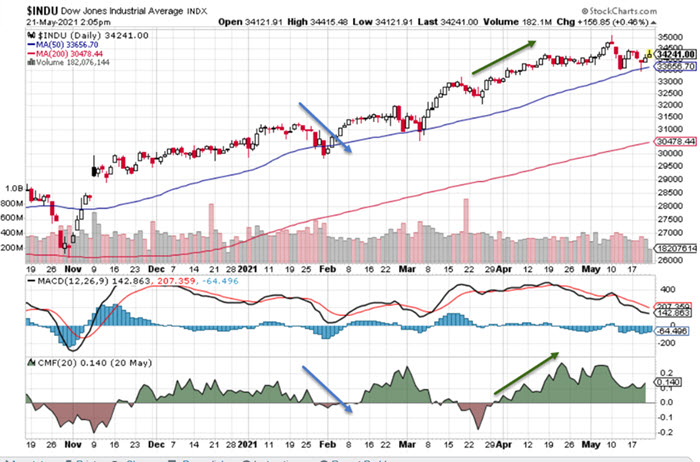 There is a whole lot of Chaikin going on! In todays blog post we are continuing the series about technical analysis and the large toolbox of indicators available. Today we are looking at an indicator that attempts to measure money flows into and out of a security.
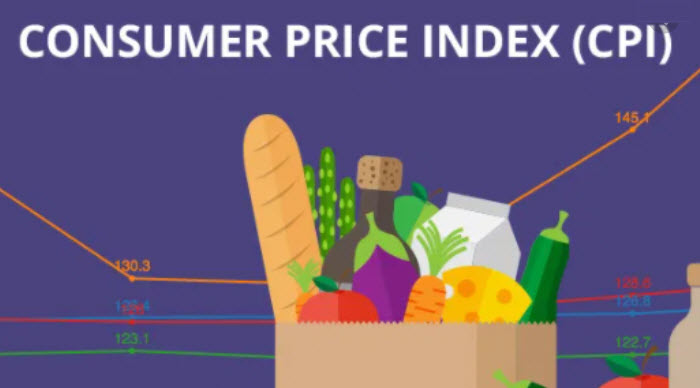 The exponential rise in the national debt since COVID began by the tune of more than $3.8 Trillion of stimulus monies was inevitably going to lead to a wave of hard asset inflation as well as consumer inflation. The only question was "how much"?
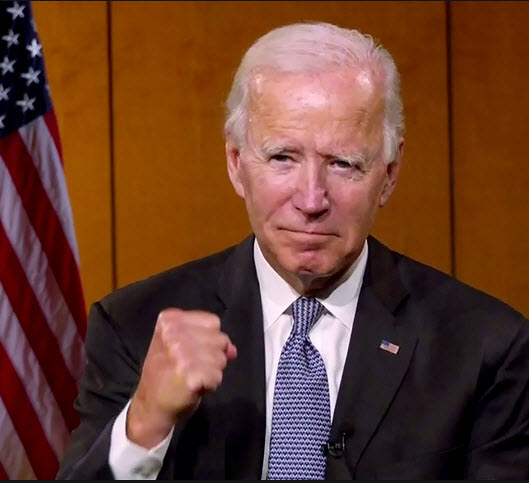 Joe Biden announced his new trillion dollar infrastructure plan last week and how he intends to fund it, which sent chills through the markets and the $400,000 plus annual income earners. Of course, this should not have come as a surprise. The odds of the Biden Administration not implementing such a key campaign promise was close to zero. What the announcement did do was sound the alarm ammong the top segment of american earners that it was time to take action and evaluate steps to mitigate taxes going forward under the likely scenarios outlined by the president.
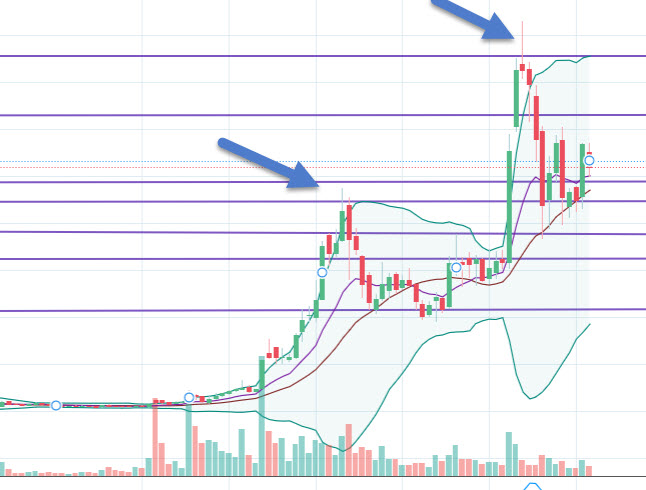 This week, we are going to continue with our "key technical indicators" series for stocks or any publicly traded instrument for that matter. Today, we are going to explore "Bollinger Bands".