
 RSI otherwise known as the Relative Strength Index is a measure of strength or momentum in the price action of a stock, commodity, ETF or other tradeable instrument. It measures the magnitude of price action strength on a relative scale and is displayed as an oscillator with a measurement parameter between 0 and 100. The top range e.g. 70-100 typically indicates relatively overbought conditions whereas the bottom range 0-30 can indicate oversold conditions within a given or chosen timeframe. The longer the timeframe over which this is measured the stronger the signal as a function of trend.
Investors and traders will use this signal to gauge - over different timeframes - from days to years, potential buy and sell decisions or portfolio rebalancing decisions. As with all technical signals they should be used in concert with other technical signals to confirm the probability or weighting of that signal's validity. Technical analysis can provide probability weightings for buy sell decisions providing a statistical bell curve that will indicate how often a signal or combination of signals in a given market, under various economic conditions and different timeframes is accurate with respect to signalling a change in trend.
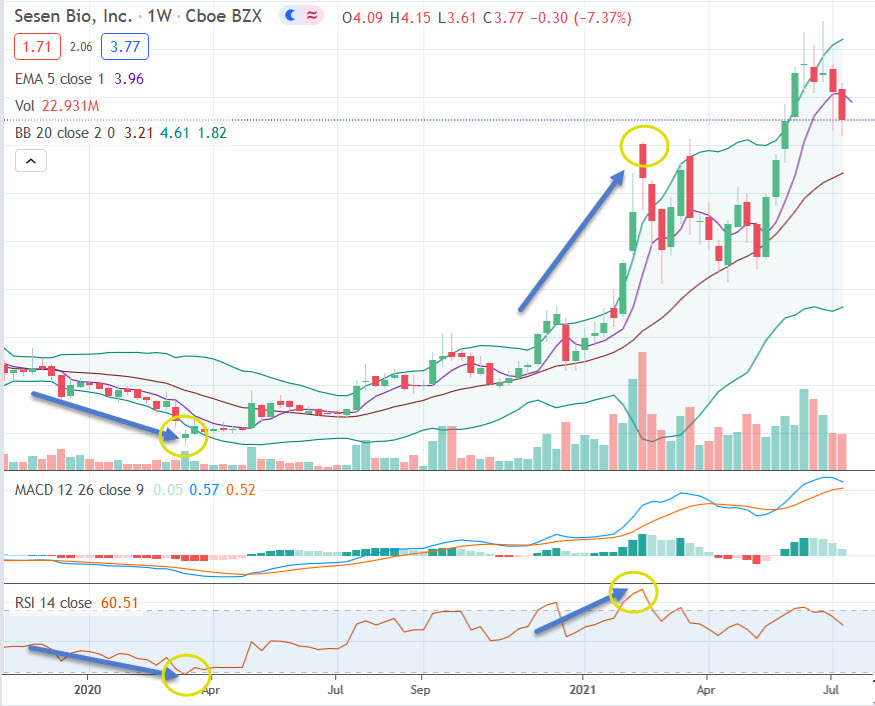
As you can see on the diagram in the left, the yellow circles show corresponding lows and highs in the weekly stock price of SESN as well as a corresponding RSI indicator below 30 and above 70. RSI indicators can show multiple signals above 70 or below 30 so the first time the line crosses over these values does not necessarily mean a low or high has been reached which is why it is best to use technical analysis in combination with a range of different signals to get a higher probability signal or confirmation of whether a shift in price trend - up or down - is pending.
