 There is a whole lot of Chaikin going on! In todays blog post we are continuing the series about technical analysis and the large toolbox of indicators available. Today we are looking at an indicator that attempts to measure money flows into and out of a security.
The Chaikin Money Flow was created by Marc Chaikin along with the Chaikin Oscillator and Accumulation/Distribution signals to measure the flow of money into or out of a security over a given period of time.
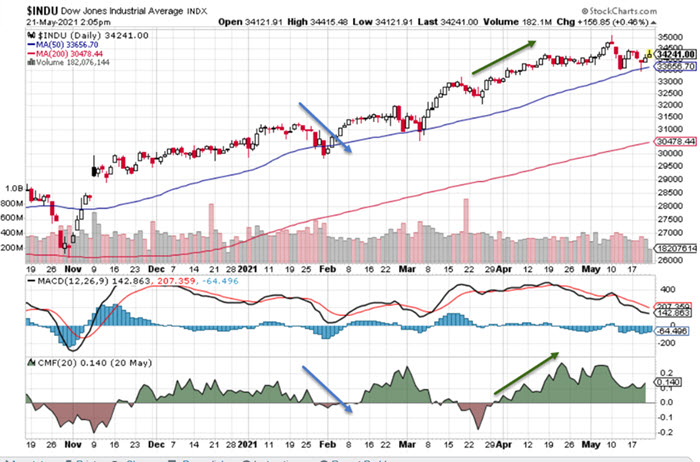
The Money Flow Volume was conceived by Chaikin to measure the buying and selling pressure for a security over a user defined period of time such as 15, 50 or 200 days. The most popular setting for this indicator is over a 20-21 day period. The value of the oscillator swings between 1 and -1 with buying pressure being greatest when the value is closest to 1 and selling pressure being greatest when the value is closer to -1.
When values cross the ZERO point, either up or down, it can help identify a shift or trend reversal in the direction of the security. As with all indicators you can get many false signals which is why it is important to use any signal in combination with other signals to test if a change is a confirming trend or not. The stronger the direction of the trend - up or down - the the more indicative it is of the prevailing investor mood over that specific time period.
Investors and traders can use these indicators over short or long term time frames to determine shifts in buyer/seller trends.