


The recent headlines in the markets are all about China's "Evergrande" which may require a name change before the dust finally settles. China's quasi capitalist front - the business class - which is under the umbrella of Communism is under fire on many fronts. Let's discuss the economic front first. Evergrande - you may not have heard of the company until now - is China's largest property developer and has been a company at the forefront of China's economic boom and phenomenal new city development and expansion. As can be the case in an economy that has been booming and expanding for decades, it is easy for companies to lose sight that "booms" always come to an end. The economic cycles in Capitalist societies are inevitable, in spite of trillions in government "funding" intervention in the last decade. China is not a capitalist society - at least not culturally - and the interesting juxta-positon between capitalism and communism under one roof is playing itself out now with "Communism" asserting itself in ways that those who have heavily invested in china are now discovering to their detriment.
Evergande's booming business was fuelled by increasing debt and leverage. As can happen, that debt to debt servicing ratio was not properly managed and the banks - yet again - failed in their fiscal due dilligence and evaluation of the company. The US equivalent often cited in the media is "Lehman Borthers". The bottom line is that "Evergrande" is teetering and on the cusp of failure, unable to service its debt with no immediate convincing plan to lower its $300 billion debt mountain. It missed it's interest payment to bond holders yesterday - thursday September 23rd - and now has a 30 day grace period to make good on this or officially be in default. The writing is on the wall. It has effectively lost the little negotiation power it may have had. It's unlikely - not impossible - that the company will survive in its current "Evergrande" form. Will the chinese state intervene? Given the millions of livelihoods at stake and economic repercussions for the region, there is a high likelihood the government will intervene in some way. In wake of China's clamping down on "businesses" that have grown too big and too powerful for the State's liking and its emphasis on the welfare of the people, we see a strong possibility that state financial aid will come, but with caveats or demands that the company be broken into several companies and assets sold off to pay down bondholder and retail buyer debt.
As we have already mentioned, we believe it is unlikely that "Evergrande" will survive in its current form.
...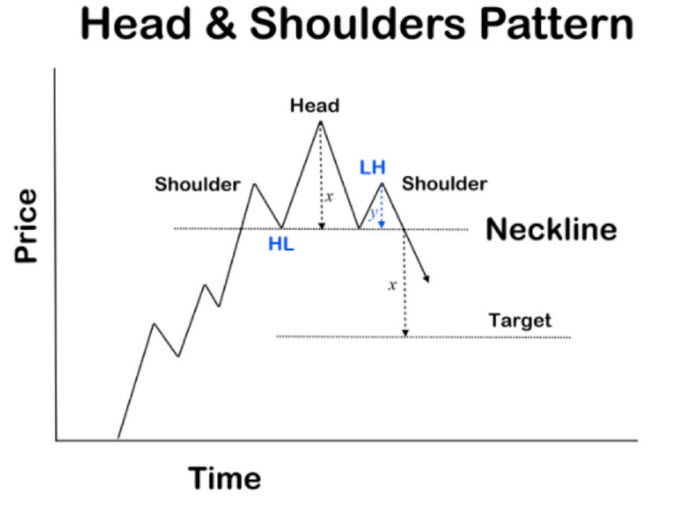 In this installment of our technical patterns education series, we will explore what is known as a "Head and Shoulders" pattern. This pattern can signal a shift in trend whether at the top of a price discovery trend or at the bottom (when it is referred to as an "inverse head and shoulders bottom" pattern).
 Institutional adoption of digital currencies and payment methods is on the rise. We are seeing a tectonic shift in the payments landscape along with the rise of Bitcoin. However, behind Bitcoin, blockchain companies and projects are looking to reinvent the way individuals and entire industries transact across the entire global industrial landscape.
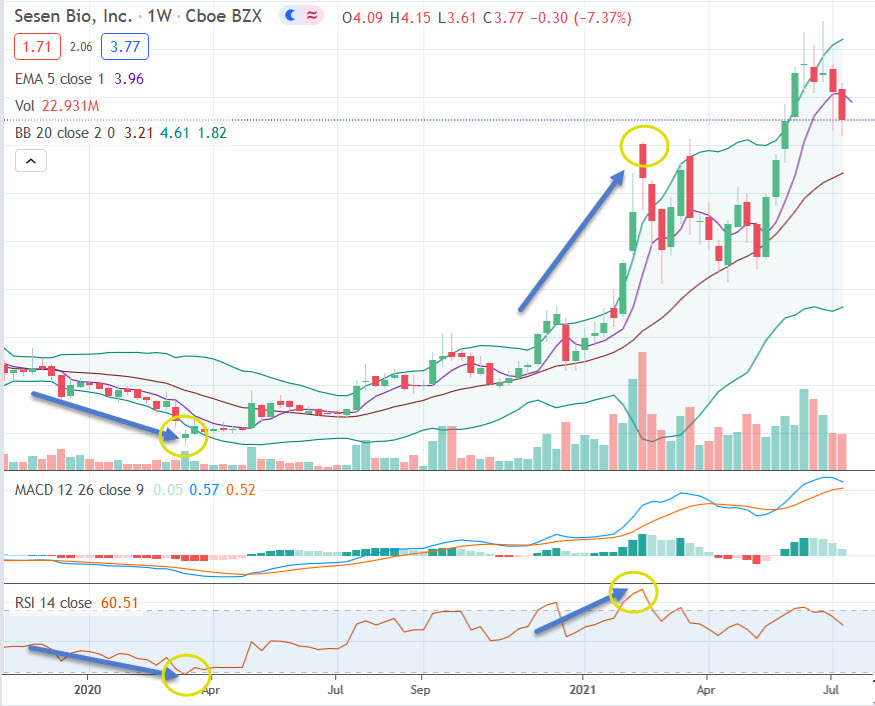 RSI otherwise known as the Relative Strength Index is a measure of strength or momentum in the price action of a stock, commodity, ETF or other tradeable instrument. It measures the magnitude of price action strength on a relative scale and is displayed as an oscillator with a measurement parameter between 0 and 100. The top range e.g. 70-100 typically indicates relatively overbought conditions whereas the bottom range 0-30 can indicate oversold conditions within a given or chosen timeframe. The longer the timeframe over which this is measured the stronger the signal as a function of trend.